Missing Voice in Philosophy
1. Introduction
Background and Research Objectives
Can you name 5 women philosophers?
Although there are many women who have done extraordinary philosophical work and have significantly influenced other philosophers of their time, their presence and contributions have been overlooked and excluded from the philosophical cannon and the historical records (Witt and Lisa, 2021).
This visualization project aims to acknowledge and highlight underrepresented women philosophers.
2. Methodology
Visualization Flow
I design a flow of five visualizations, each of which serves the main goal from different perspectives, ranging from academic contributions to social connections.
Following the "show-not-tell" principle, the first and second visualizations highlight the existing bias in historical data representation in Philosophy; the third visualization shifts the focus from overall connections to the intellectual work of specific women philosophers; and the last two visualizations are concerned with the situation of women as philosophers in today's society.
- (Intellectual) Philosopher Influence Network
To contract the men philosophers centered in the canons with marginalized women philosophers, revealing the bias in data that the influence and contributions of female philosophers have been ignored.
- (Historical) Missing History
To show that women philosophers are unjustly ignored and excluded from the narrative of the history of philosophy.
- (Conceptual) Intellectual Universe
To introduce and appreciate the intelligence of women philosophers and their contributions to philosophy.
- (Academic/educational) Gender Composition
To demonstrate the gender ratio of faculty members in philosophy programs.
- (Social) Philosopher Community on Social Media
To summarize and compare today's women and men philosophers' activity and popularity on Twitter.
Data Preparation
To answer the research question from various perspectives, I choose and preprocess the data from four sources.
- The data for the Influence Network is extracted by Jonas Mayer (2020) from Wikipedia, which specifies the influence relationship (influence or be influenced by) between philosophers. The data consists of 1008 philosophers’ names, basic descriptions, id, and overall influence scores (Pagerank). I add a categorical property “gender” and identify the women philosophers by gender-specific pronounces (she/her/hers).
- In the Women Philosopher Concept Starmap, I map the 180 concepts of women philosophers scraped from the website Encyclopedia of Concise Concepts by Women Philosophers. I use python to clean the data and compute the occurrence of each concept and women philosopher (numerical).
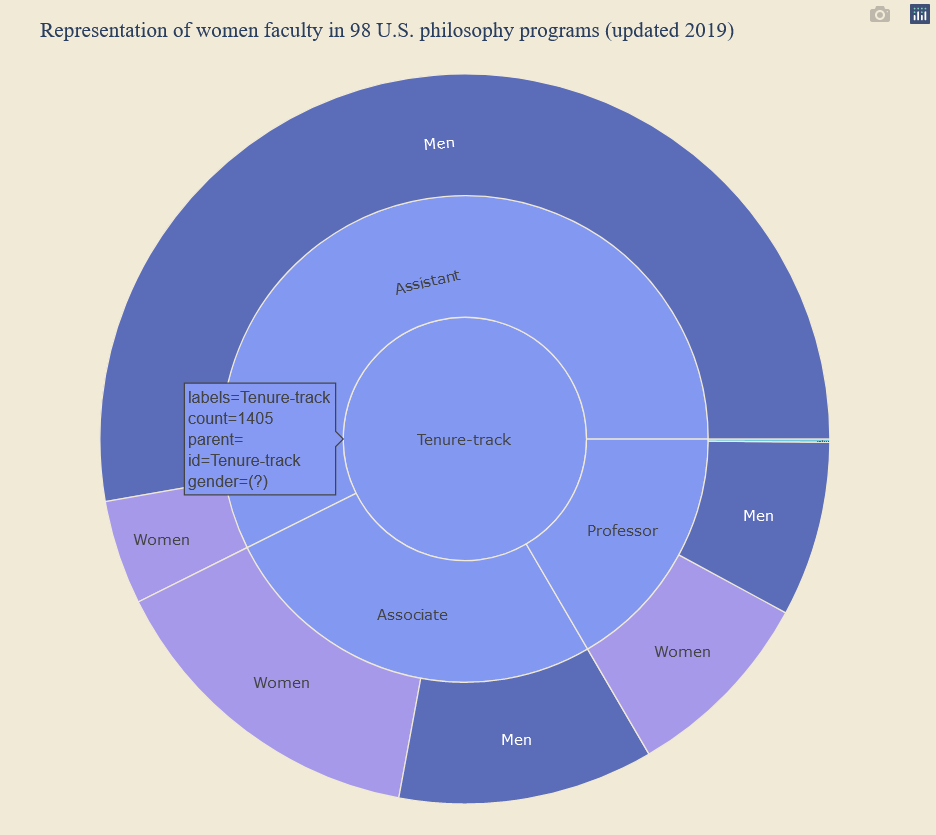
- The Gender Composition Sunburst Visualization shows on representation of women faculty in 98 U.S. philosophy programs by 2019, with the data provided by Peterson and Hustoft (2021). There are title categories (categorical) and counts of women faculty in each category (numerical). The categories include Emeritus Faculty, Tenure-track Professor (Professor, Associate Professor, or Assistant Professor), and Nontenure-track Professor (Visiting Professor, Adjunct Professor, or Lecturer).
- The Twitter data is extracted from the website Philosophers on Twitter, where Truelove (2022) posted the collection of philosophers’ Twitter accounts and their statistics, including username, account name, websites, self-description, years on Twitter, followers amount, and peer followers amount. To be included, an account must have at least 1,000 Twitter followers and the individuals have a Ph.D. By 2022-May-09 11:03 UTC, there are 1095 entries.
I first save the HTML files (philosophers_list.html and women_philosopher_list.html) directly from this website and then use python to extract elements from them. I add a categorical property “gender” and then transform the data into json and csv files to import to the visualization.
Technical Approaches
Data extracting, cleaning, and transforming: python
Visualization 1-3: D3.js (1 and 2 are adapted from Jonas Mayer’s theschoolofathens (2020); 3 is built based on ObservableHQ’s star map)
Visualization 4-5: Plotly Python
3. Visualization Results
The link: https://www.junyitao.com/research/womenPhilo/
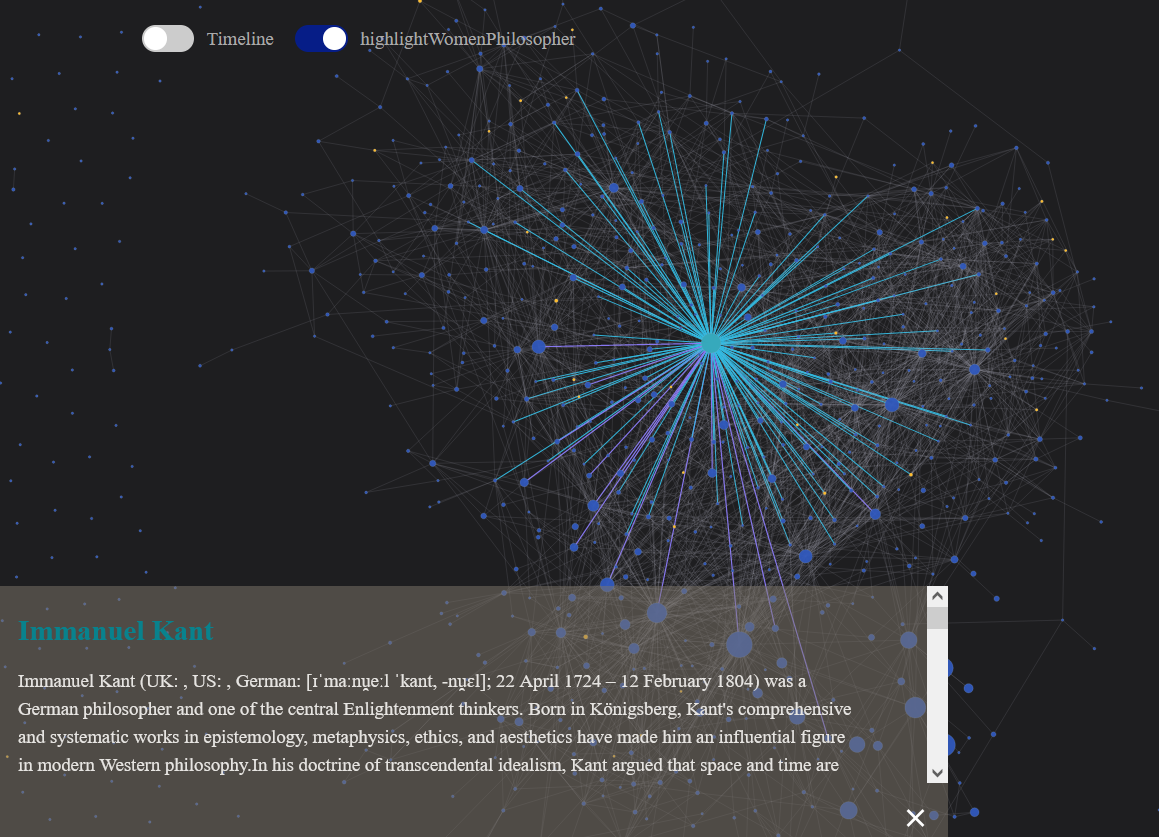
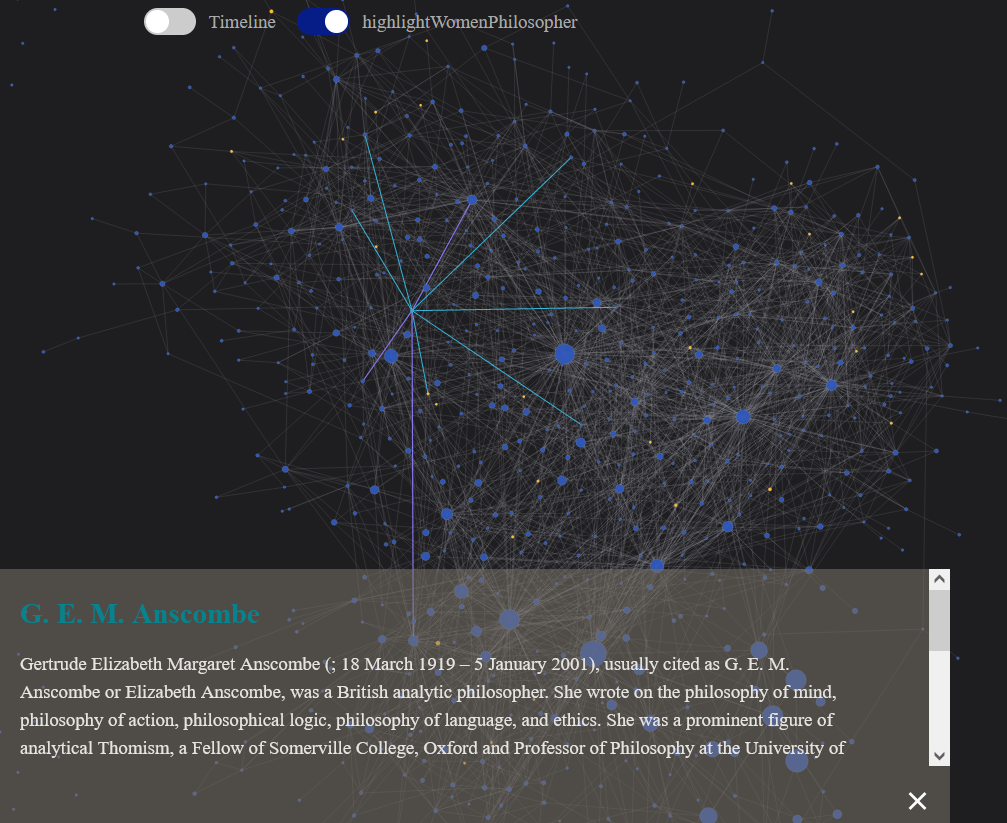
Vis 1: Philosopher Influence Network
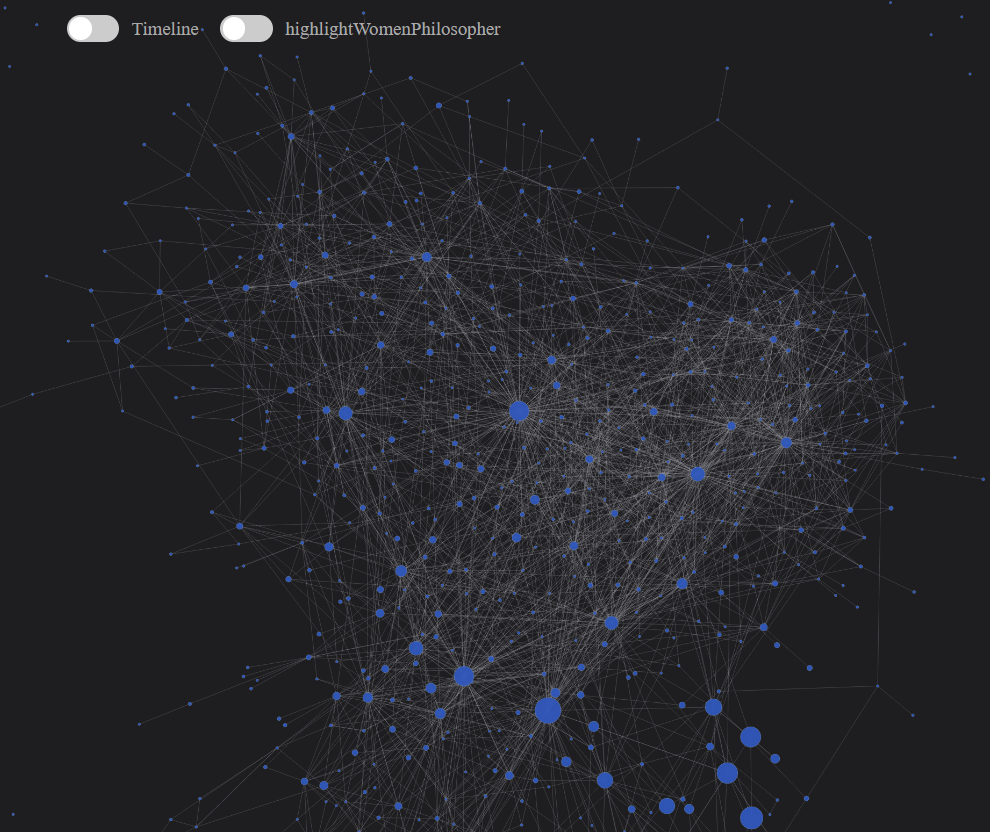
- Idiom: force-direct network
- Marks (point, line) and Channels (color, size)
- Node (point): Philosopher; link (line) : influencing or be influenced relationship
- Node Size: overall influence of the philosopher (calculated as Pagerank score)
- Node color: SkyBlue = selected node, Cyan = node matched by search, Yellow = women philosophers
- Link color: Turquoise = Influenced by selected node, Violet = Influence on the selected node
- Efficiency and accuracy:
Node sizes provide users with an intuitive understanding of the influential power of certain philosophers. The colored nodes and links clearly differentiate themselves from each other and communicate the messages of enlightening, intellectual contributions of philosophers, especially the selected nodes and highlighted women philosophers nodes, shining like stars in the night.
- Interactions and user tasks:
Users can freely zoom in and out and drag the nodes in this network.
Click on the information board to look at the guidance about data representation and interactions:
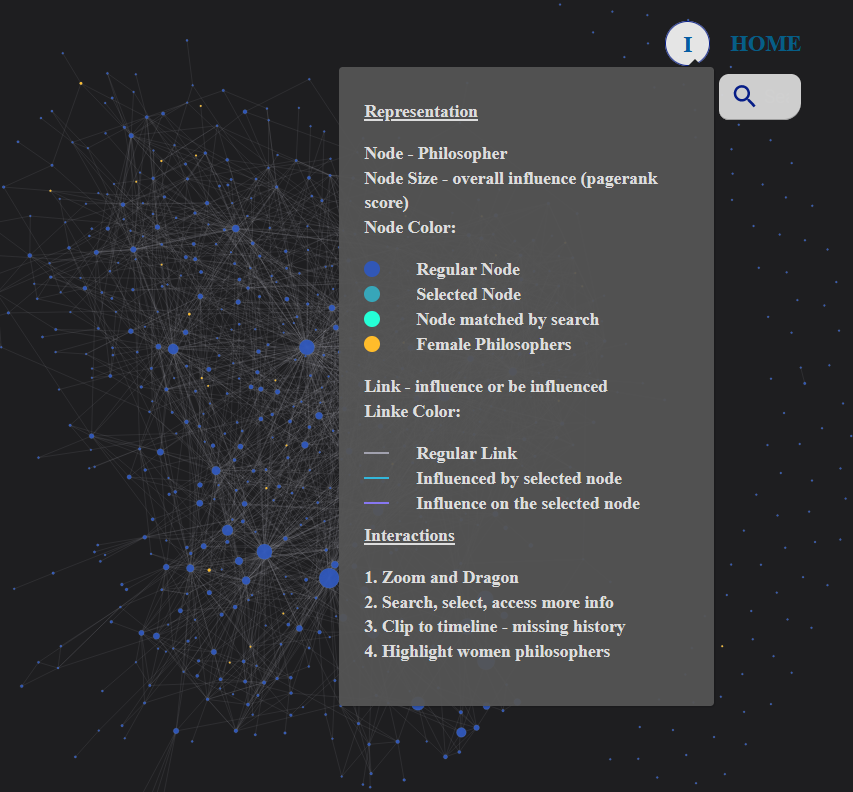
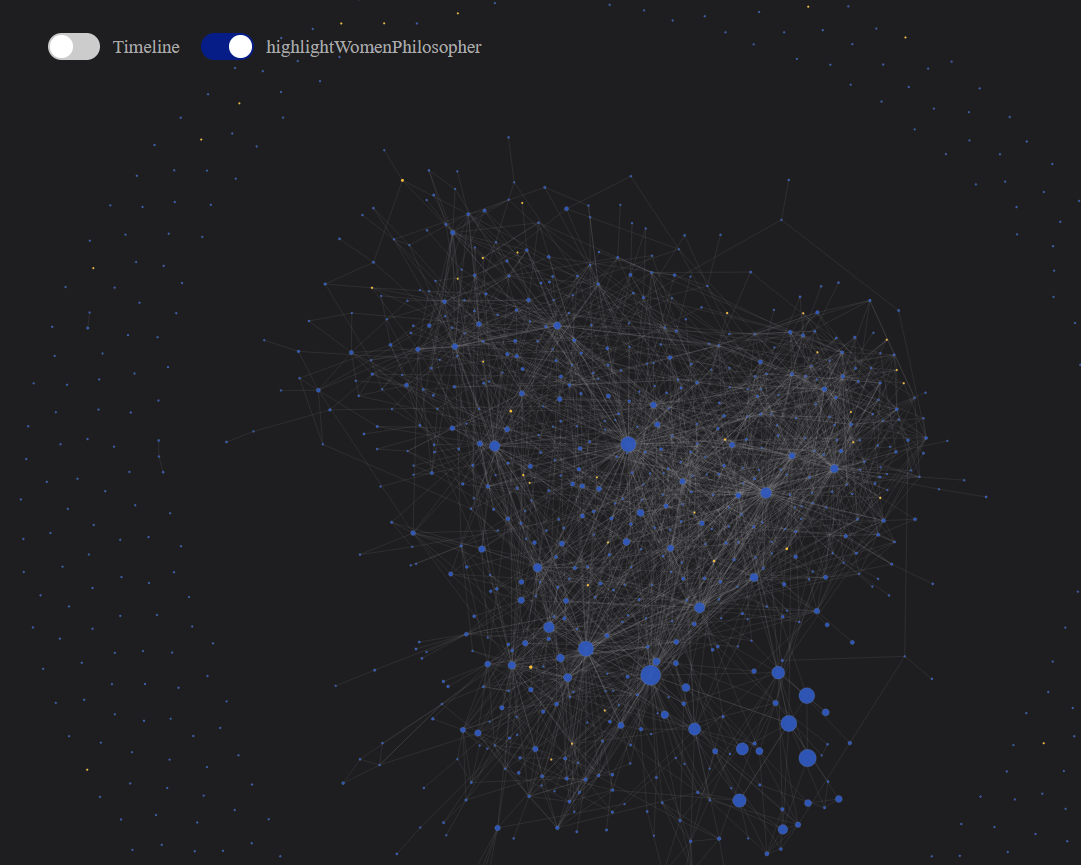
The swift button on the top left allows the user to highlight the women philosophers in bright yellow, simulating the lightning stars in the dark sky. The stars are almost unrecognizable, buried in the blackness and dark blue nebula (men philosophers and their influence), which is aligned with our prediction of the marginalization of women in philosophy.
This visualization also enables keyword searching, which will match the name containing the typed keywords and colored the corresponding nodes:
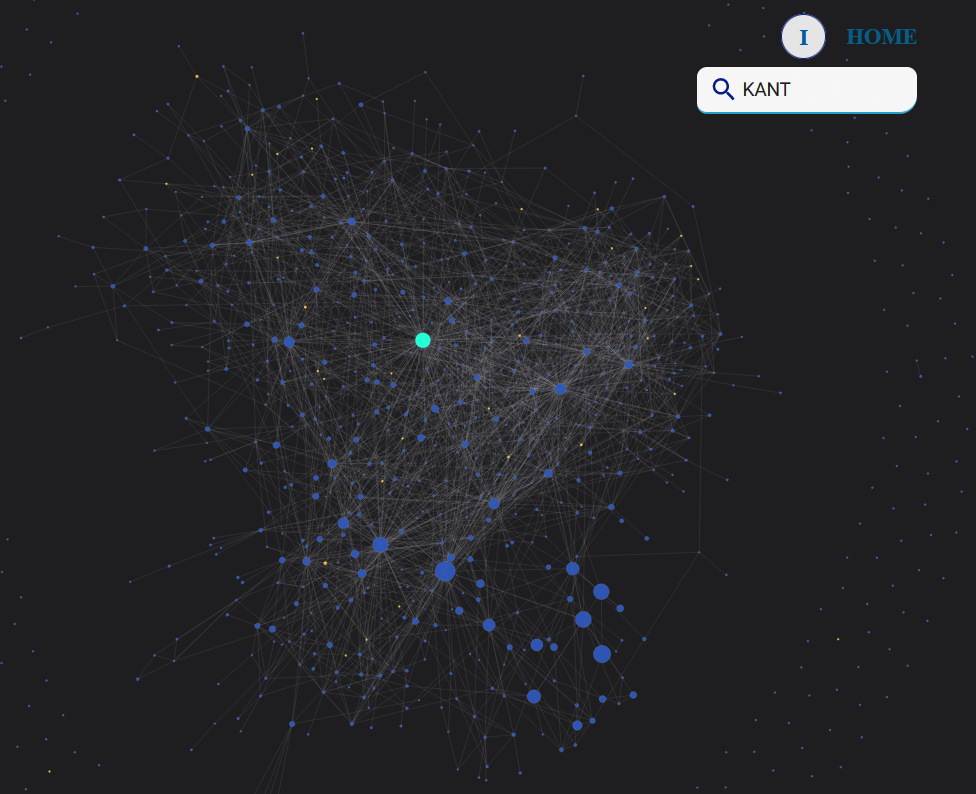
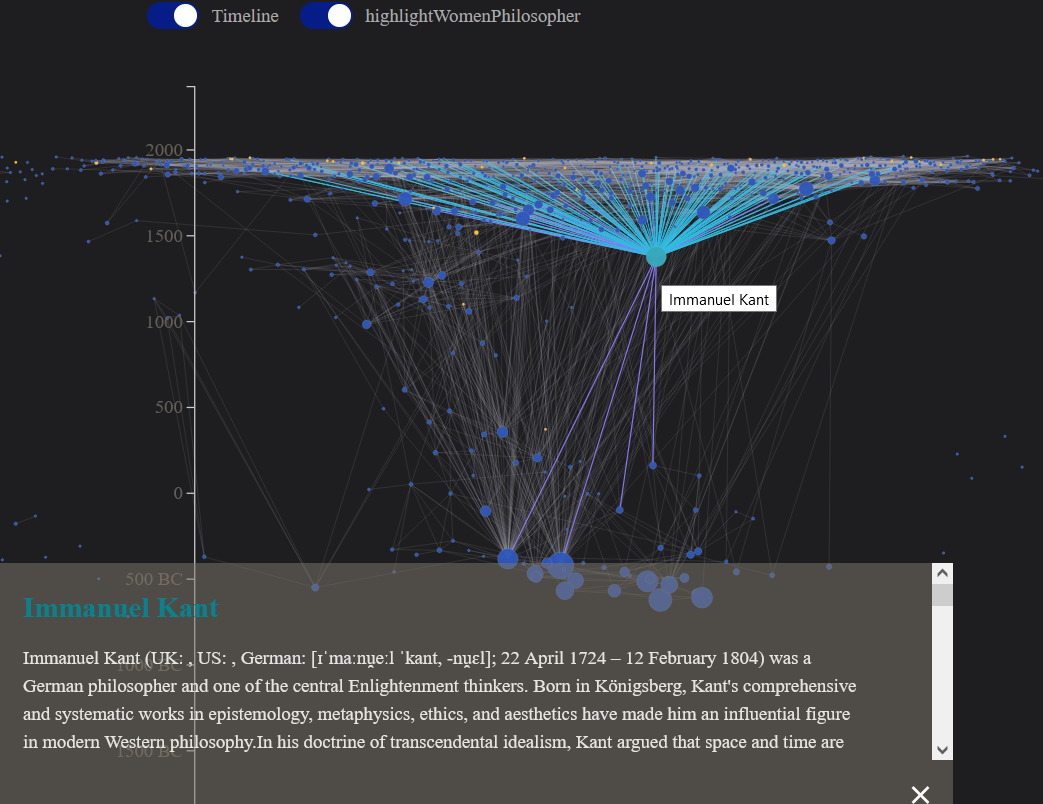
Click on a node (philosopher) and view the philosopher’s influence on other philosophers and who has influenced him/her/them. An information card will also float upon click, showing the Wikipedia description of the selected philosopher.
The first screenshot below is the influence network of Immanuel Kant (he/his), who has numerous vastly recognized influence relationships; the second one is the about G. E. M. Anscombe (she/her), whose influence is more sparse.
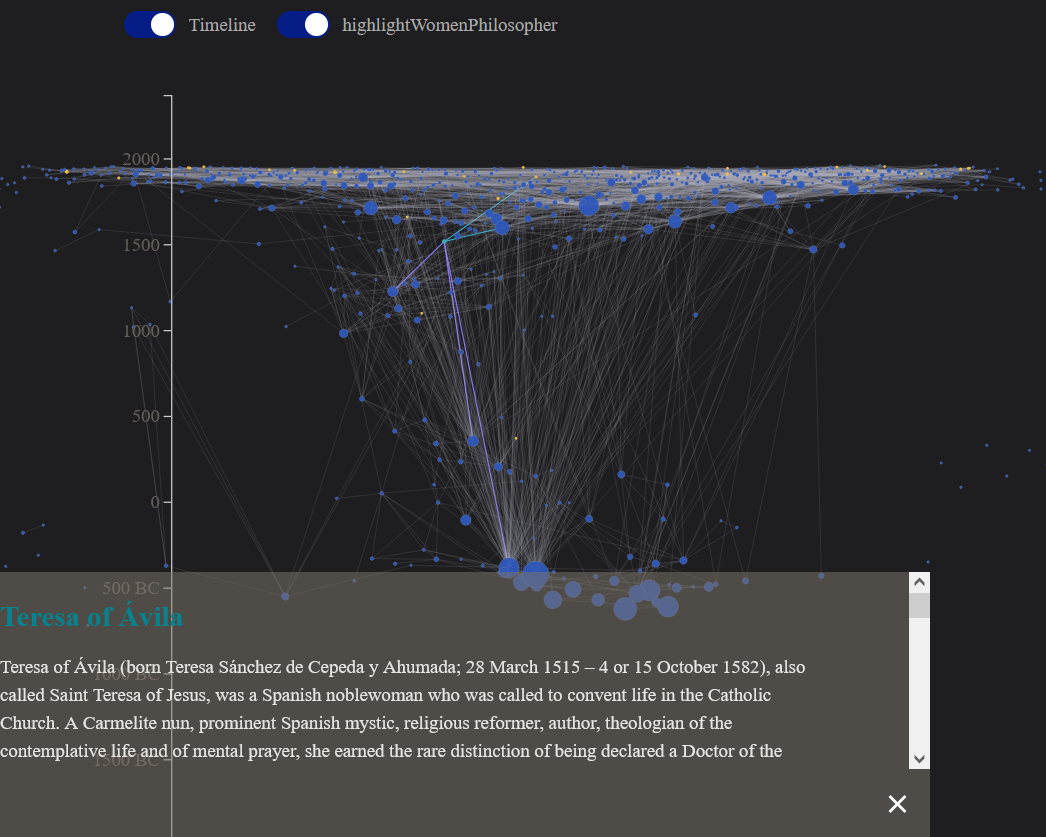
Vis2: Missing History
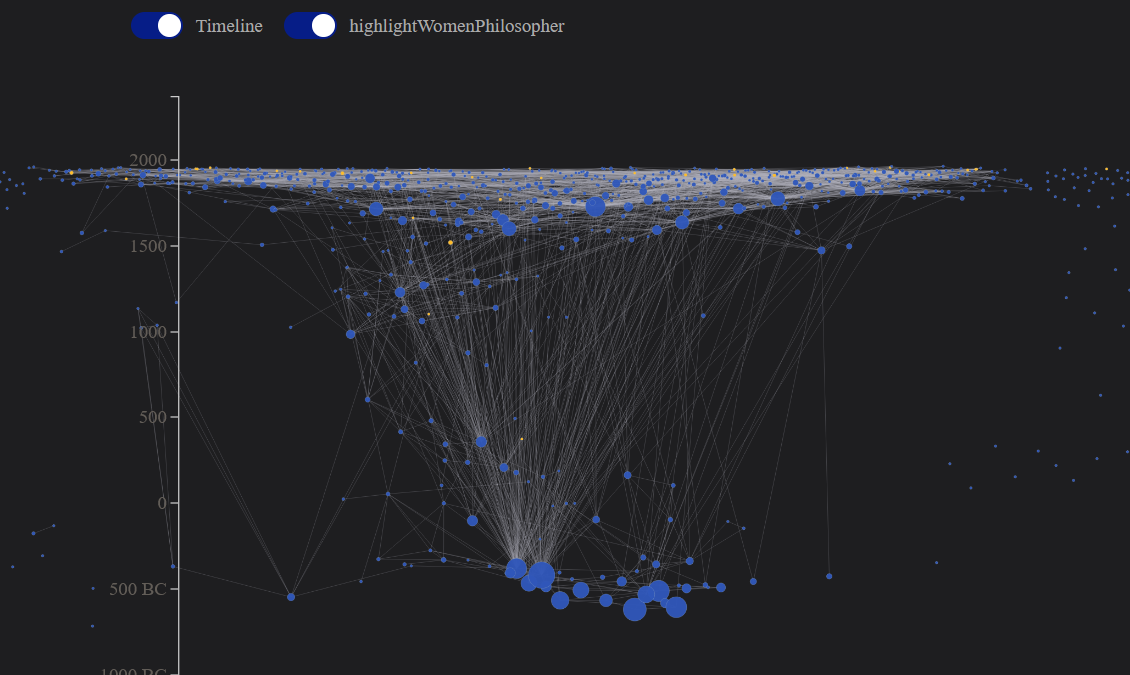
- Idiom: force-direct network
- Marks (point, line) and Channels (position, color, size)
- Node (point): Philosopher; link (line): influencing or be influenced relationship
- Node position (vertical, the timeline): date of birth of the philosopher
- Node Size: overall influence of the philosopher (calculated as Pagerank score)
- Node color: SkyBlue = selected node, Cyan = node matched by search, Yellow = women philosophers
- Link color: Turquoise = Influenced by selected node, Violet = Influence on the selected node
- Efficiency and accuracy:
The timeline view visualizes the abstract philosophy development historically, giving users a sense of philosophers as a community and the lack of women representation throughout the time.
- Interactions and user tasks:
The interactions are the same as in the first visualization, as they present the same dataset from two views. The following screenshots capture the highlighting of women philosophers and the annotation of selected nodes and links, respectively.
Vis3: Intellectual Universe
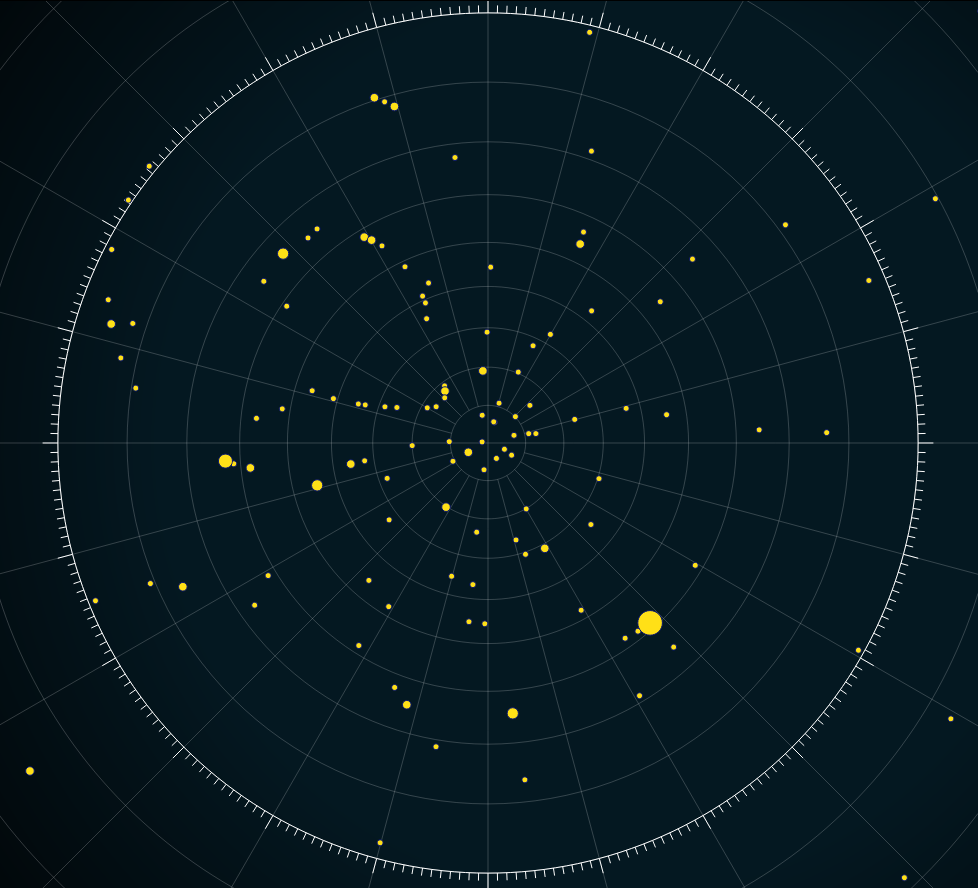
- Idiom: star map
- Marks (point) and Channels (size, position)
- Point (the star): women philosophers’ concepts
- Star Size (radius): the occurrence count of the certain concept
- Star position: distance to the center ( = weighted values of its authors’ visibility = 1/sum(occurrence of the authors) ) and angle (alphabetic order of the concept, which implies the topics clustering to some extent)
- Efficiency and accuracy:
The star map mimics the stary night, successfully conveying the acknowledgment and appreciation of women philosophers’ intelligence both as individuals and as a group.
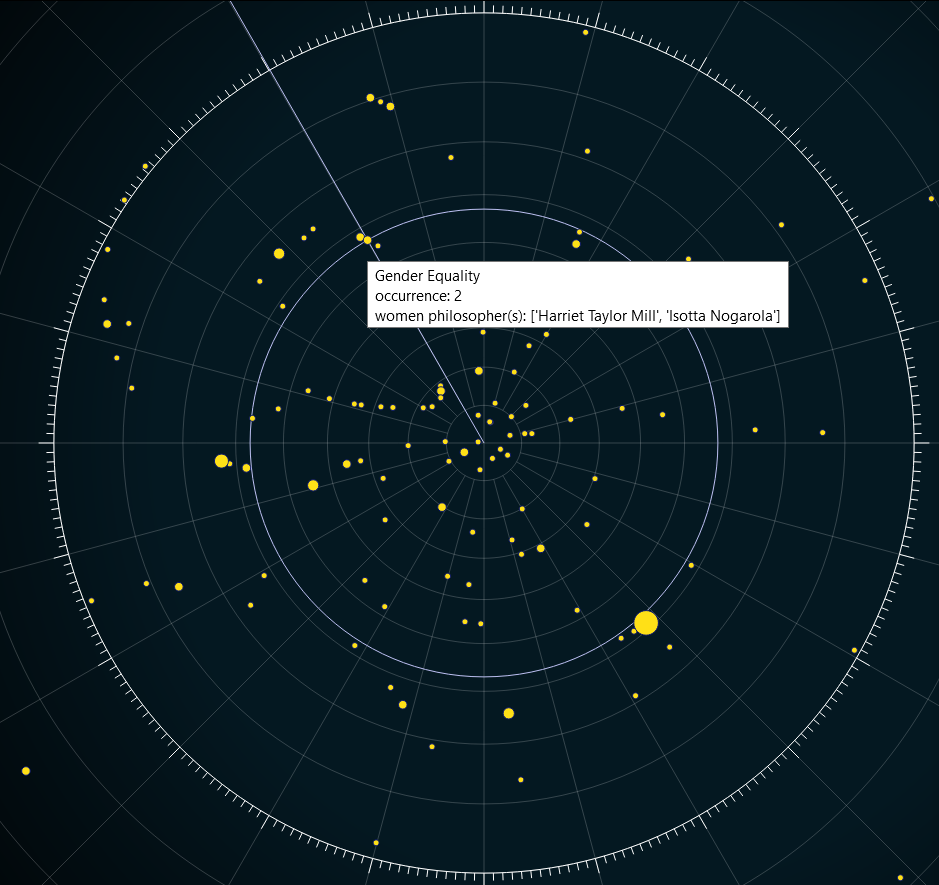
- Interactions and user tasks:
Hovering over a circle mark, users will be able to see the name, occurrence count, and authors of the specific concept. At the same time, a line and a circle crossing the star will show up, helping users to compare it with other concepts.
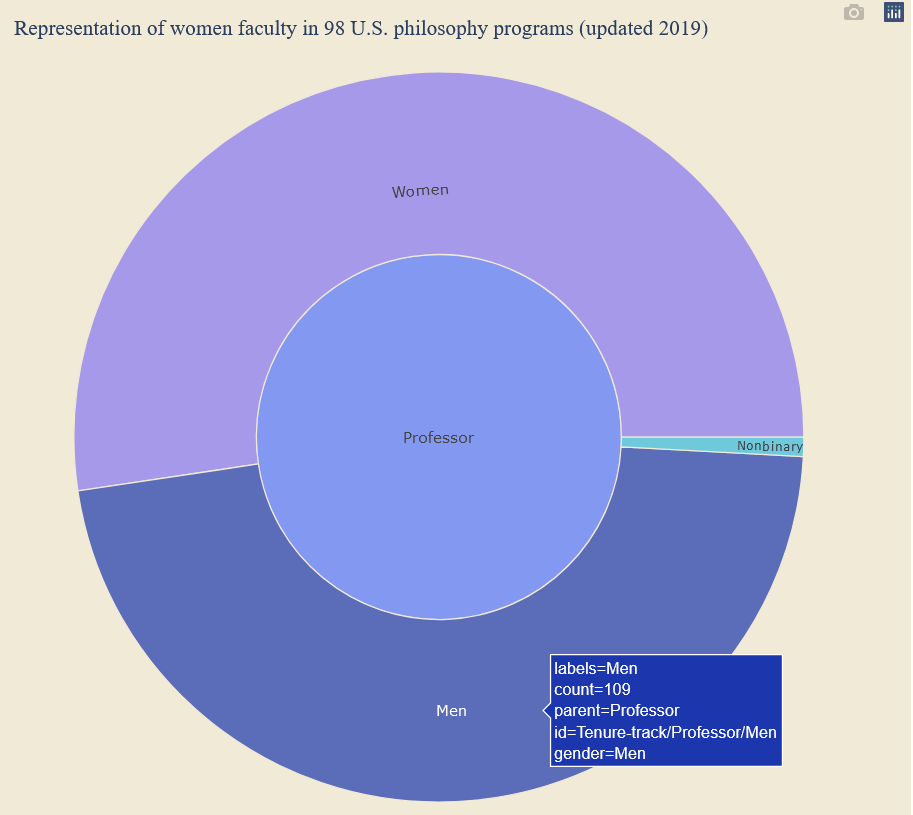
Vis 4: Gender Composition
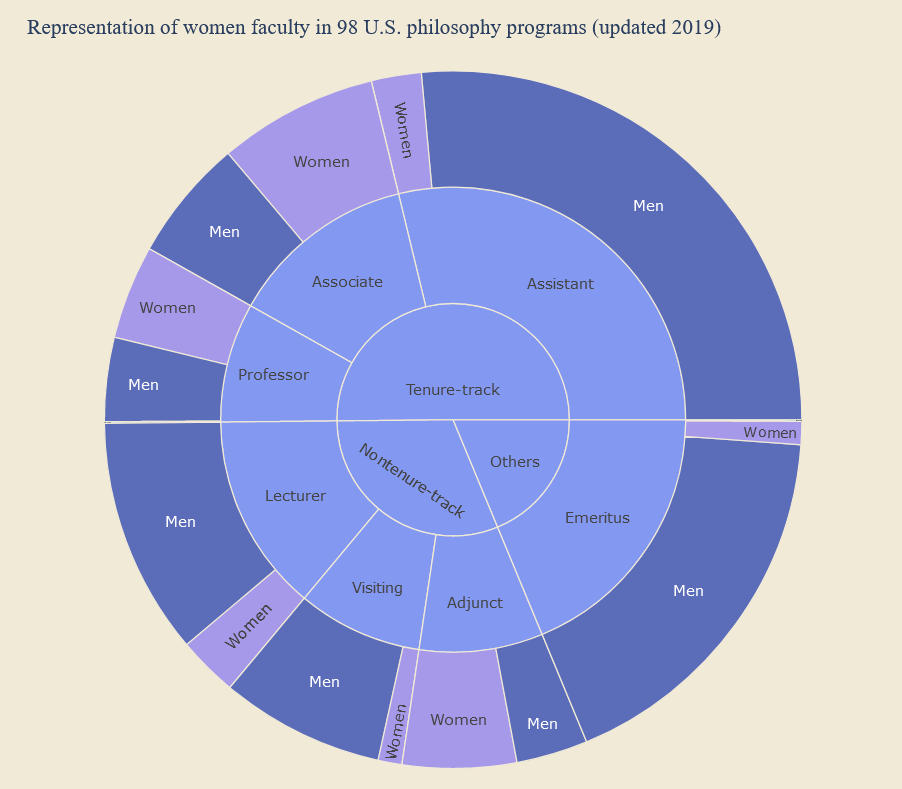
- Idiom: sunburst chart
- Marks (area) and Channels (color, size)
- Area: categories of faculty members’ profession titles and their genders
- Area size: the count of philosophers in each title category and genders
- Area color: CornflowerBlue = title categories; Darkblue = gender as men, Purple = gender as women, Cyan = gender as nonbinary
- Efficiency and accuracy:
The area sizes are perceptually accurate and efficient in showing and contract the distribution/proportion of genders in Philosophy faculty members.
- Interactions and user tasks:
Users can click on one parent category and see the branching out of its children categories and associated values. Meanwhile, if hovering the mouse over a label, its relevant information will be shown.
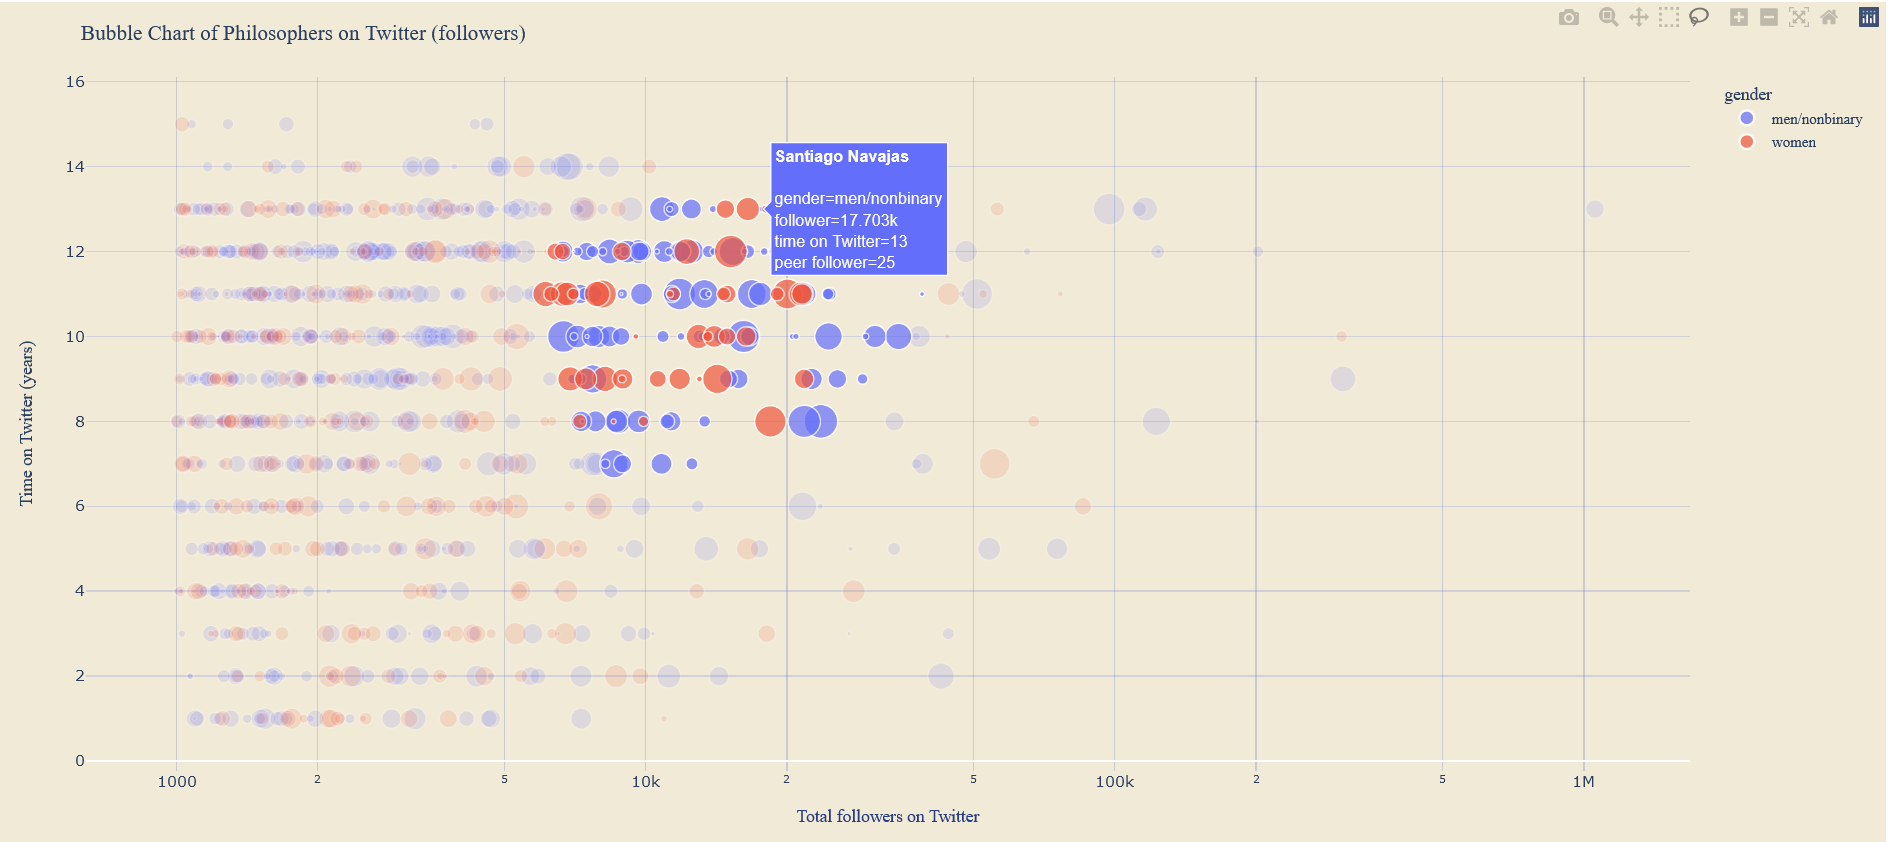
Vis 5: Social Media Community
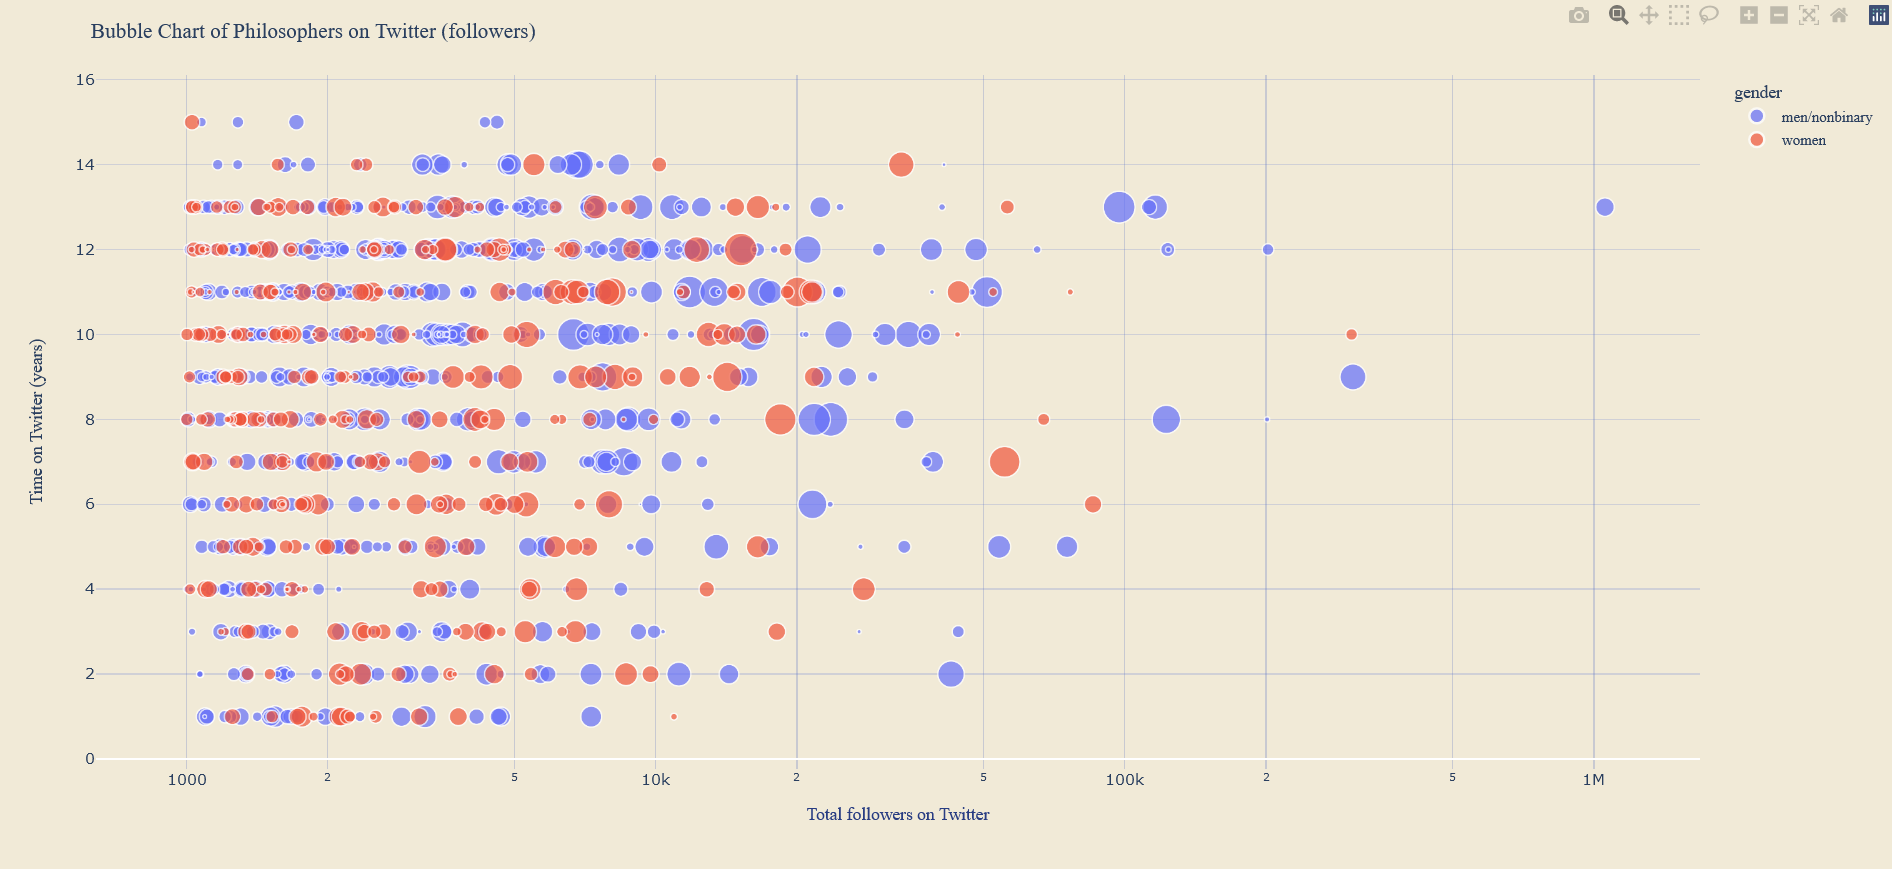
- Idiom: bubble chart
- Marks (bubble) and Channels (position, color, size)
- Bubble: philosopher’s Twitter account
- Bubble size: the count of peer follows of the Twitter account
- Bubble position: x-axis (count of the total followers) and y-axis (the account’s years on Twitter)
- Bubble color: Red = gender as women, Blue = gender as men or nonbinary
- Efficiency and accuracy:
Though the bubble sizes are not very differentiable, the red and blue colors clearly show the overall distribution of the visibility and popularity of men and women philosophers on Twitter.
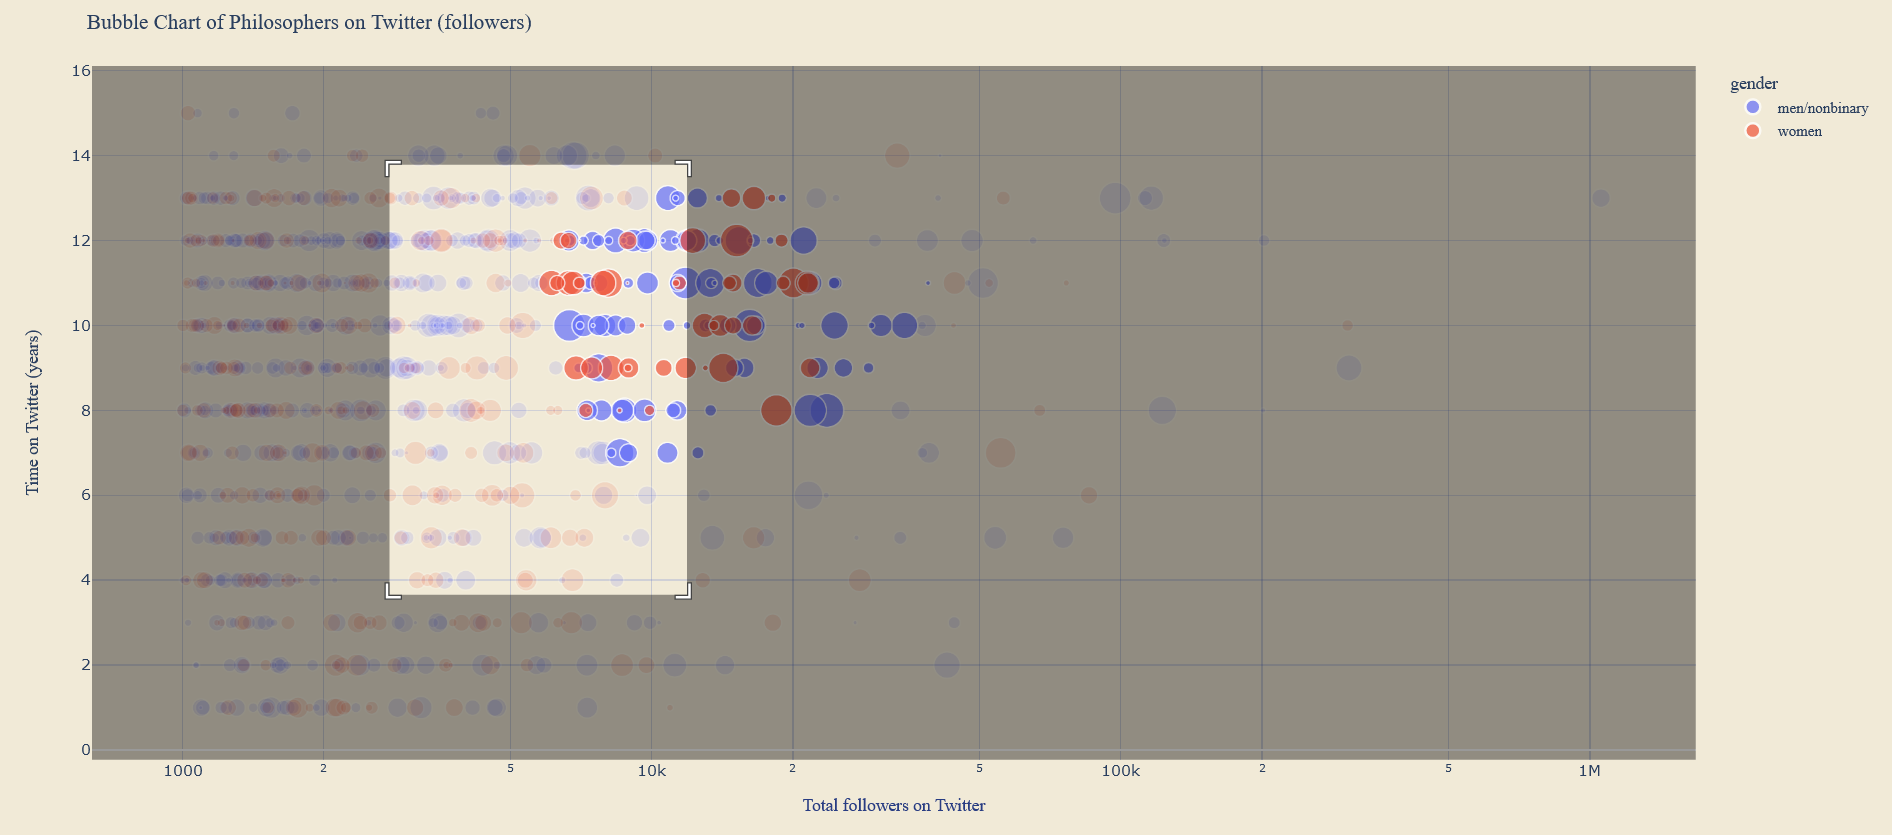
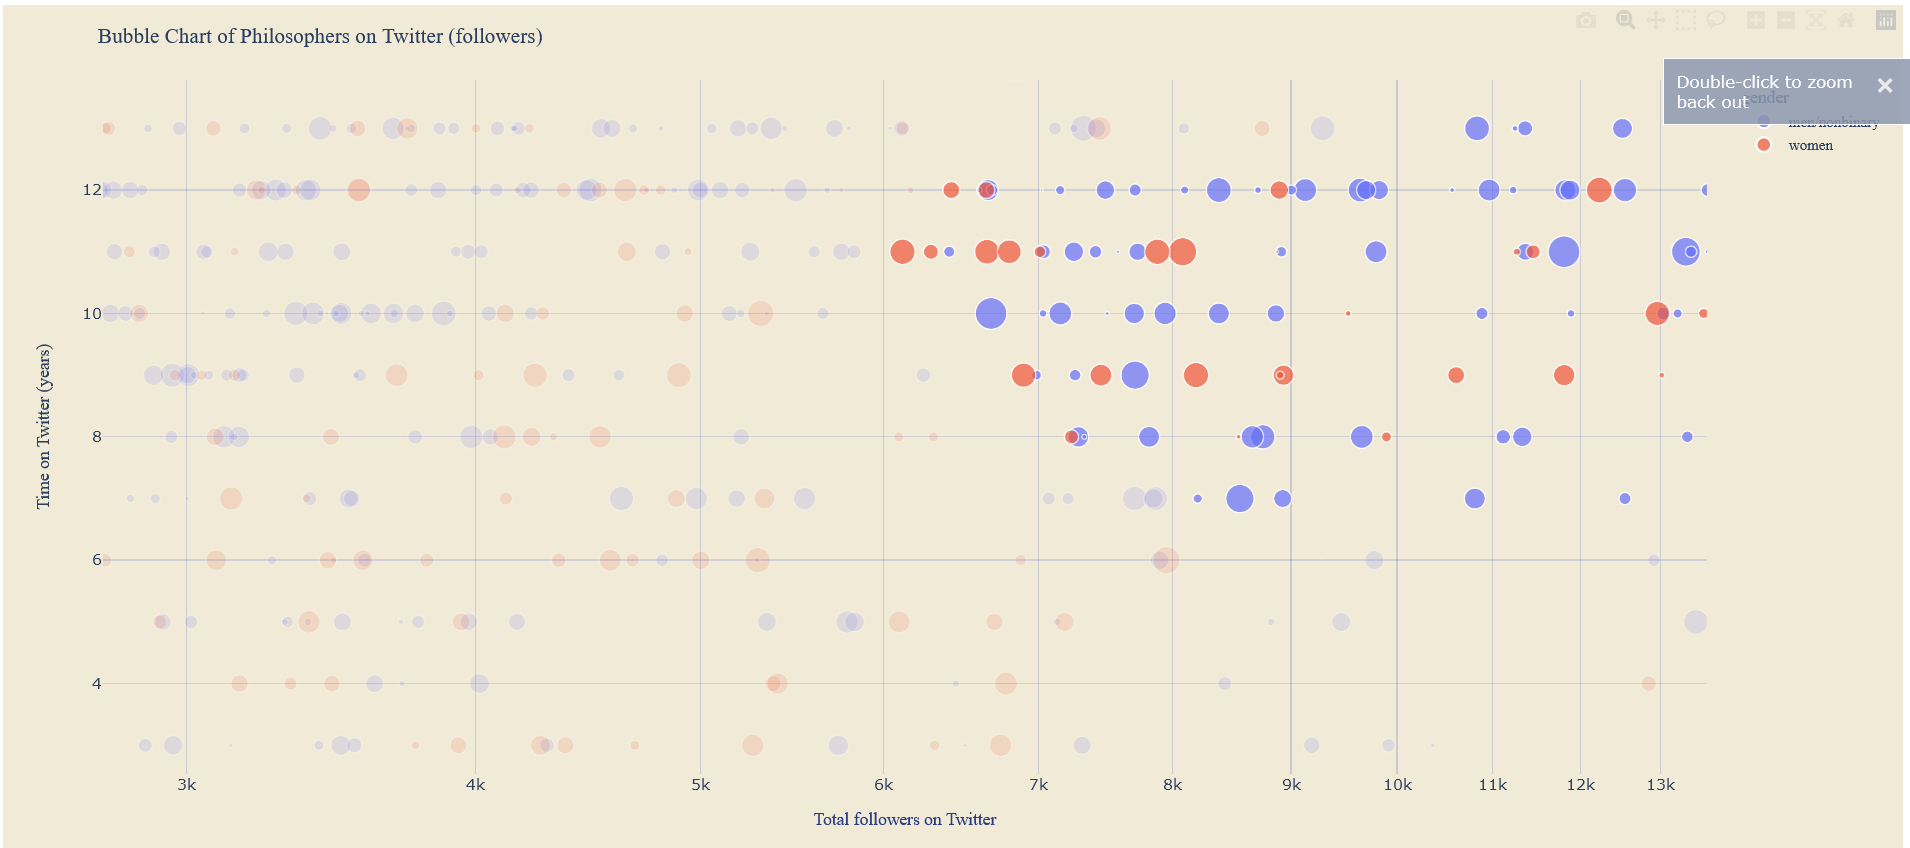
- Interactions and user tasks:
To gain a more concentrated focus and reduce distractions, users can select certain items and examine the local features of the information. The unselected parts will fade into the background, making the selected part more noticeable.
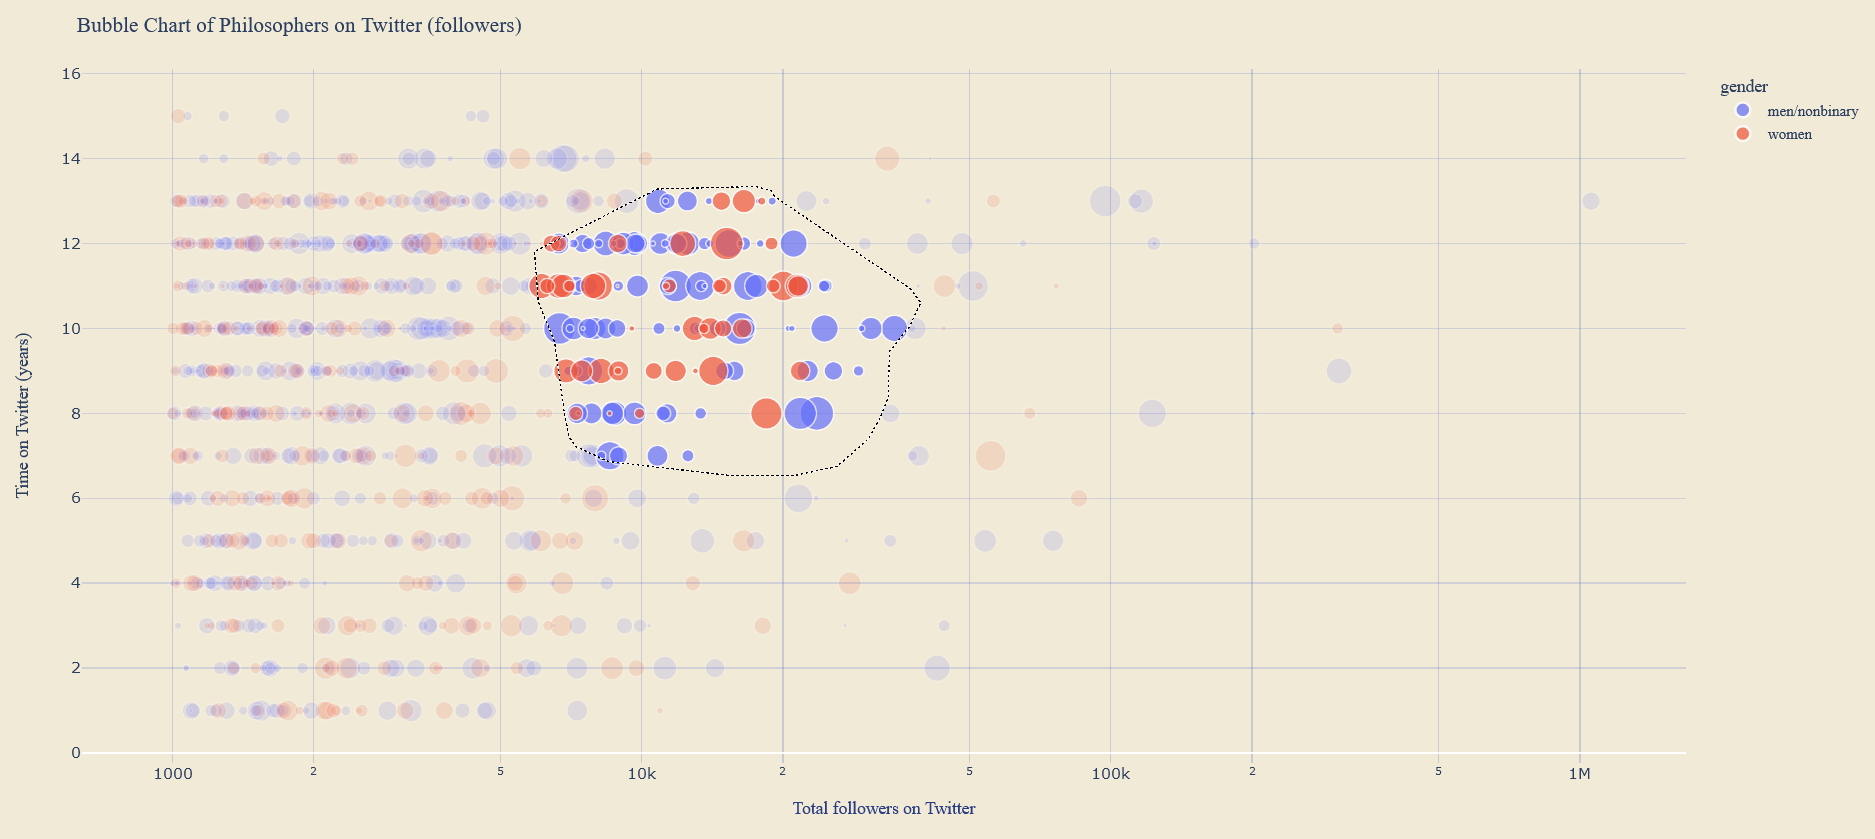
Users can also access the information in detail with the filter and zoom-in function. The axis is going to be scaled accordingly.
4. Discussion and Conclusion
My visualizations demonstrate the marginalization and omission of women in the history of Philosophy. They also show today’s women philosophers’ situations.
User tasks and Interactions
Following the flow of the visualizations, users will first be presented with the visualized story of women philosophers being marginalized and discover the voices missing from the traditional narrative. Beyond browsing and exploring the massive visualized information, they are able to search for details of the derived information and have a more local concentration on the information by zooming selecting, and filtering. Finally, they are expected to compare and summarize the patterns of mainstream and marginalized groups. Hopefully, they will have a sharper eye for identifying voices that are unjustly ignored in the future.
Efficiency
Overall, the visualizations are efficient because they employ appropriate idioms and encoding to achieve the goal of discovering and highlighting women philosophers who have been overlooked in the history of philosophy. Specifically, I use networks to show the big picture and recognized connections among philosophers, use sunburst chart and bubble chart to demonstrate the gender distribution in Philosophy, and use star map to facilitate user exploration and appreciation of the ideas of women philosophers.
Pros/Cons
This project features a variety of perspectives, from conceptual to interpersonal. Narratives are examined in different time periods - we review the history of philosophy, but also examine the current state of women's philosophy in academia and social media communities.
However, the transition between perspectives could be smoother to provide a more integrated perspective and way of thinking about the data representations.
Limitations and Potential Resolutions
Due to limited time and resources, this visualization project is primarily descriptive, i.e., it presents existing data without very much statistical analysis. But it is also my aspiration to investigate the patterns of marginalization, the underlying assumptions of mainstream narratives, and the historical representations of gender inequality in Philosophy. I might use machine learning methods to model the patterns of marginalization and make corresponding prediction models. Furthermore, my future research will extend to other marginalized and ignored groups.
References
Hagengruber and Waithe. (n.d.). The Encyclopedia of Concise Concepts by Women Philosophers. Retrieved May 09, 2022, from https://historyofwomenphilosophers.org/ecc/#hwps
Kelly Truelove. (2022). Philosophers on Twitter. Retrieved May 09, 2022, from https://truesciphi.org/phi.html
Peterson and Hustoft. (2021). Second Wave Survey of Women’s Representation in U.S. Philosophy Graduate Programs. Retrieved May 07, 2022, from https://doi.org/10.7910/DVN/IJZW8Y
Witt, Charlotte and Lisa Shapiro, "Feminist History of Philosophy", The Stanford Encyclopedia of Philosophy (Summer 2021 Edition), Edward N. Zalta (ed.), URL = <https://plato.stanford.edu/archives/sum2021/entries/feminism-femhist/>
Roles and responsibilities
Brainstorming and idealization: Junyi Tao
Data searching, extraction, and cleaning: Junyi Tao
Visualization building and publishing: Junyi Tao
Writing and editing: Junyi Tao